
Before we go into details of AWS CloudWatch Alarm, understand an alarm and when it triggers. An alarm triggers after an event happens in the AWS. An event, let us say, is a breach of a metric. Again, the metric is a required threshold (we need to define it). Understand, here are the steps you need to set up an alarm.
So alarm triggers a notification for the support (operations) team. Then support team will act on the issue and provide the solution.
AWS CloudWatch Alarm
The practical definition is it triggers (notification/production remedy ticket) when a specific event happens. And alarms are part of CloudWatch.
CloudWatch
Amazon CloudWatch is a fundamental logging and monitoring service in the AWS service landscape. It can monitor the AWS resources and the custom applications running on the AWS cloud in real time.
What does CloudWatch do
- CloudWatch can collect and track metrics. When a threshold breach happens, it can also create alarms that watch these metrics.
- It sends notifications (automated changes) to the monitored resources.
- CloudWatch can help with visibility into resource utilization, application performance, and operational health.
CloudWatch basically has two sections. One is Log Stream, and the second one is Log group. Why is divided into two parts? One is a stream which means a sequence of events. The other one is Log Group which can have details of multiple log streams.
What is the relation between the Log stream and Log group
- Log stream: A log stream is a sequence of log events that has a common source. Hence, each separate source of the log can make up a separate log stream.
- Log group: A log group is a group of log streams that share the same monitoring, access control, and retention settings. A single log group can have multiple log streams associated with it.
Services publish logs on CloudWatch
Amazon API Gateway, AWS CloudTrail, Amazon ECS, Amazon EKS, AWS Lambda, Amazon Route53, Amazon SNS, Amazon VPC, etc.
How many types of alarms you can set? Two types of alarms you can set:
- Metric alarm: This type of alarm watches a single metric or result of a math expression based on the CloudWatch metrics. The alarm can perform one or more actions like sending notifications, auto-scaling actions, etc.
- Composite alarm: A composite alarm includes a rule expression that is created based on the alarm states of the other alarms. This type of alarm goes into the ALARM state only if all the conditions of the rule are satisfied. While a composite alarm can send a notification, it cannot perform EC2 or auto-scaling actions.
CloudWatch Alarm Status
The alarm has three status representations as below:
- OK: The metric or expression is within the defined threshold.
- ALARM: The metric or expression is outside the defined threshold.
- INSUFFICIENT_DATA: The alarm has just started, and the metric is either not available or enough data is not available to determine the state of the alarm.
Steps to create CloudWatch alarm
Step-1
ClouWatch=>Alarms=>Create alarm

Step-2
All=> S3=>Storage Metrics
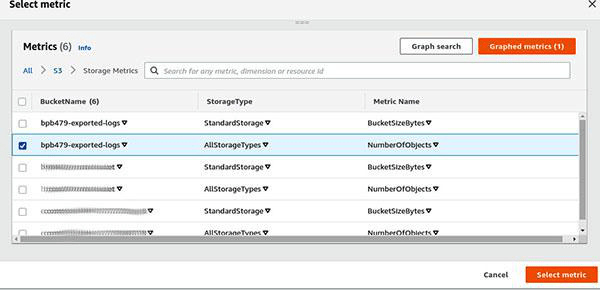
Step-3
Provide statistics
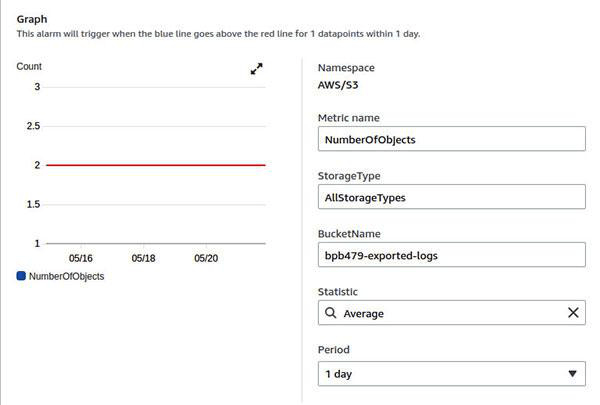
Step-4
Provide conditions
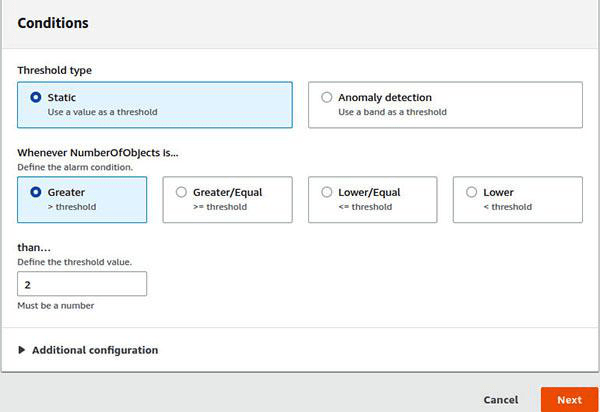
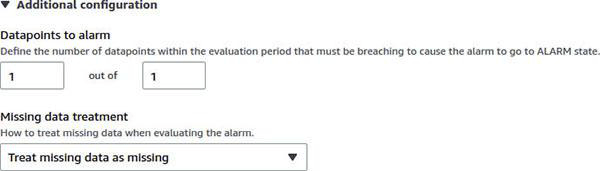
Additional configuration.

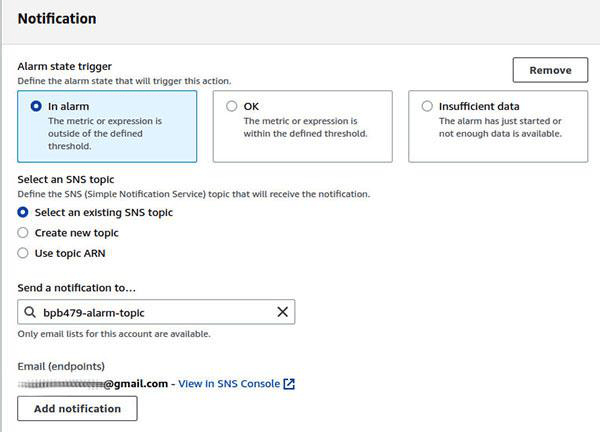
Step-5
Give alarm settings.
Additional Configuration
A data point is the value of a metric for a given metric aggregation period i.e. if you use one minute as an aggregation period for a metric, then there will be one data point every minute.
Define Alarm state

Provide alarm name. Initially, the status is ‘In sufficient data’. Once data is received it state will change accordingly.
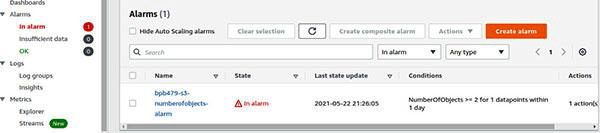
Finally, each log is associated with one service/object( for instance, an S3 bucket). Then, you will get the alarm name associated with which logs. You can trace out the issue from the logs and their events.
The steps you need to follow when the ticket is generated for an alarm
- When you receive a ticket for any alarm, first, check the alarm state.
- Then find the associated log.
- Then check the metrics.
- Check associated log events. In events, you will find the errors which cause to trigger an alarm.
Related posts
References


You must be logged in to post a comment.