
Dashboards are a critical part of Grafana. It takes up most of the space in the interface. Everything outside the dashboard controls at the top of the screen, and the navigation bar is the dashboard space.
A dashboard is a collection of panels. Panels are actual charts, graphs, numbers, tables, and other objects that show data.
By design, Grafana can use any panel with any data source, so regardless of where your data is, you have the same options for visualizing it.
It means you can easily combine data from multiple sources of different natures. And still have a uniform representation of everything in one place.
Grafana Dashboard: How to Customize it
The first step is to create a Grafana cloud account. The link for Grafana Cloud is https://grafana.com/products/cloud/
Once your account has been configured, select the Data source, which you can choose AWS metrics ( these are the Cloudwatch metrics defined in the AWS).
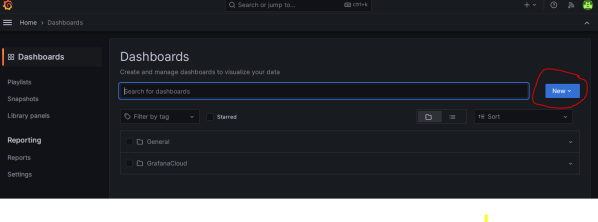
Next, create a new dashboard by selecting the option NEW. And Save it with a simple name.
While creating the dashboard, fill in the AWS IAM role credentials and the AWS service name (AWS/Kafka). When you click the install button, your dashboard will be active.
Creating a panel
I have created a Test-1 dashboard, which you can search for in the below screen:
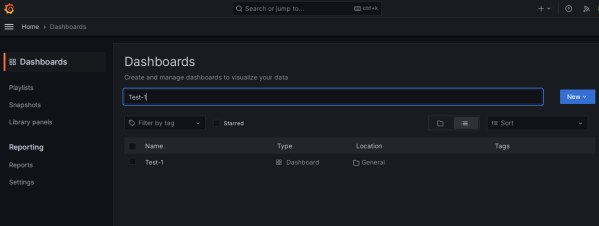
The panels are nothing but individual visualization units. You can give a short name for it. And you can select the type of chart to be displayed.
Now configure the panel. Then understand query options.

Max data points
The maximum number of data points that Grafana can handle depends on various factors such as the hardware resources of the system, the amount of memory available, and the size of the data being queried.
However, there is no hard limit on the number of data points that Grafana can handle.
It limits the number of data points to be displayed in a graph or panel to 5000.
This limit is set to prevent the browser from becoming unresponsive when rendering a large number of data points.
However, this limit can be adjusted by changing the max_data_points setting in the defaults.ini file or by setting it in the panel configuration.
Minimum interval
The minimum interval refers to the smallest time interval that can be used for displaying data in a graph or panel.
The minimum interval is determined by the resolution of the data and the time range of the graph.
By default, Grafana sets the minimum interval to 1 second. This means that if the data has a resolution of less than 1 second, it will be downsampled to 1-second intervals.
This default setting can be changed by modifying the min_interval the configuration option in the panel settings.
Interval
The interval refers to the time range of each data point that is displayed in a graph or panel. The interval is determined by the time range of the graph and the resolution of the data.
Relative time
Relative time is a way of specifying a time range for a graph or panel based on a relative offset from the current time.
Timeshift
Timeshift is a feature that allows you to shift the time range of a graph or panel by a fixed amount. This can be useful for comparing different time ranges or for visualizing trends over time.
Related


You must be logged in to post a comment.