Here are the steps to fix incidents that trigger from AWS CloudWatch Alarms.
AWS CloudWatch Incidents
- You can create alarms in the AWS CloudWatch on a specific metric. A metric can be failed login attempts, CPU usage, Server is down etc.
- When an alarm triggers ( after it crosses the defined threshold limit, as configured), a Remedy ticket automatically triggers the support team.
- The support (operations) team should analyze the root cause of the issue.
How to resolve AWS incidents: 7 steps
Step#1
Check the ticket description to know the AWS account (It may get from Production, Development, or Integration accounts). Then login into that account using your IAM role credentials.
Step#2
After you log in, in the AWS console search for CloudWatch.
Step#3
Next, click on the alarms list, and go to the alarm in question. It could be in the red, which means in alarm state.
Step#4
Now, you can verify the graphical display and timestamp when the alarm triggers (timestamp).
Step#5
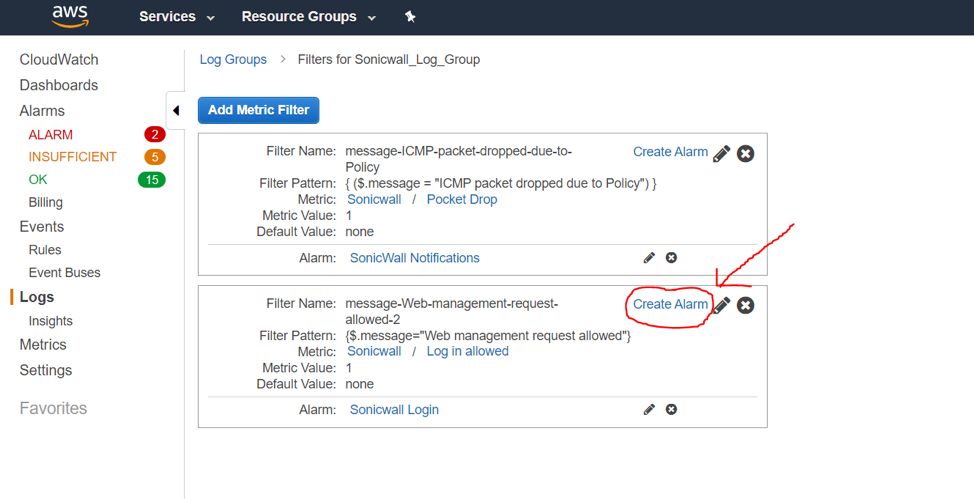
Go to the log groups list, and select the log-group in which the alarm metric is defined. Below, you will find the relation between the log group and the alarm.

Step#6
Select the relevant log group, and go to the latest log stream. The other way, you can find the log stream by filtering the time.
Step#7
Once you get the event details, you can check the error and find the root cause of the issue.
Keep reading
Related


You must be logged in to post a comment.